


Your Command Center for Real-Time Retail Performance
.webp)
Experience full visibility across your retail universe - from shelf photos to IR
predictions, from planogram compliance to ROI analytics -all in one platform.
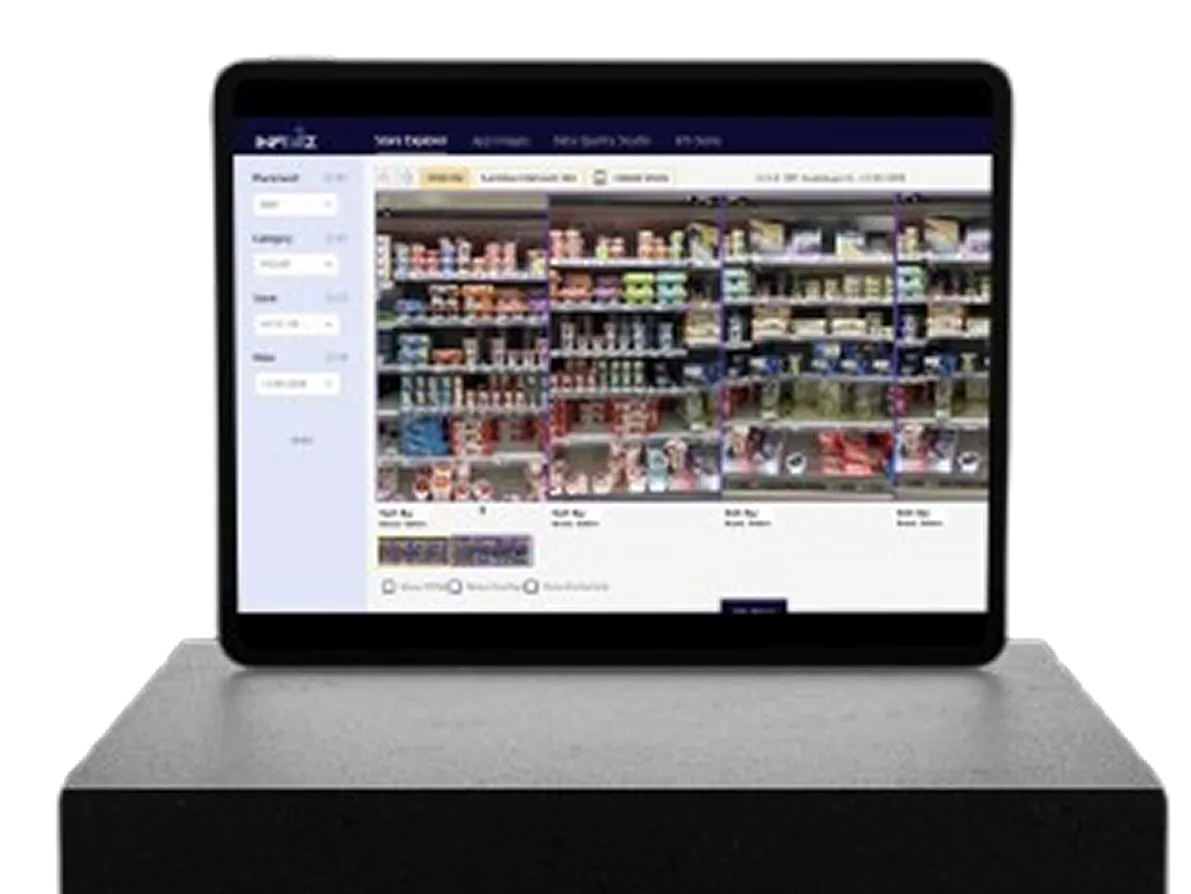
InfiView's advanced image recognition models process shelf photos from any store or retailer - automatically detecting SKUs, facings, pricing, and promotional tags in seconds.


Get correlation and causation reports of the effect of changes in SOS & OSA on per-store sales
Use multi-filter views to navigate by store, category, or region
Visualize session explorer results with color-coded boxes showing overlapping vs non-overlapping vs exclusion zones
Shelf row vs bay segment breakdowns
Click on any SKU to reveal product hierarchy, price tag recognition, and promo visuals
View planogram compliance with real-time red or green markers
Advanced AI that understands retail complexity across every aisle and format
.webp)
Recognizes side-facings, combo
packs, and multi-pack displays
.webp)
Adapts to different lighting and slanted photos across store environments
.webp)
Supports cross -category accuracy - from Yogurt (Danone) to Condiments (Kraft Heinz)
.webp)
Detect branded displays across
categories -automatically naming
assets
.webp)
Track category growth, SKU availability, and product movement
at scale.
.webp)
Measure OSA (On-Shelf Availability) and pinpoint out-of-stock
regions by retailer, category, or time period.
.webp)
Audit SOS (Share of Space), planogram compliance, and
sequence accuracy — right down to the bay and shelf row.
.webp)
Correlate shelf performance and visibility metrics with store-
level revenue, ensuring every square inch drives returns.
Built-in analytics for every core KPI
.webp)
SOS (Share of Space)
OSA (On-Shelf Availability)
Planogram Compliance — Bay, Row, and Sequence-level
Pricing & Promotion Compliance
Task Performance Metrics
Each dashboard allows HQ and regional managers to filter by store, retailer, or category — while live alerts flag critical deviations instantly.
Dashboards designed for every role in your organization
.png)
Track field team visits, task completion, and in-store execution metrics.
.webp)
View store-specific compliance and
performance benchmarks.
.webp)
Measure adherence to display and
category guidelines.
.png)
Define and monitor what 'Perfect'
looks like across markets.
Switch Contexts. Stay Connected.
Easily toggle between stores, regions, and categories - all data updates instantly. Download
insights in XLS format, or integrate directly into your enterprise stack via InfiView APIs.
.webp)
Direct downloads for offline analysis
.png)
Direct API integration capabilities
.png)
Power BI or custom dashboard
integration
Extend the power of InfiView with our complete ecosystem

Real-time performance alerts and operational health metrics
.webp)
Conversational AI for instant access to shelf insights
.webp)
Secure APIs for integration with enterprise data warehouses
InfiView is built to scale with your operations — empowering HQs, field teams, and analytics functions
with unified, visual retail intelligence.
.webp)
View Any Store, Any Category
Filter Analytics Based on Retailer, Category, Month
Actions, Tasks & Role-Based Performance Embedded
View Store–Category–Asset Photos and Predictions
Dashboards for Category, Space, Revenue, and ROI
Export Reports in XLS or APIs


.png)
.png)
.png)
.png)
.png)
.png)
.png)
.png)
.png)


.png)
